
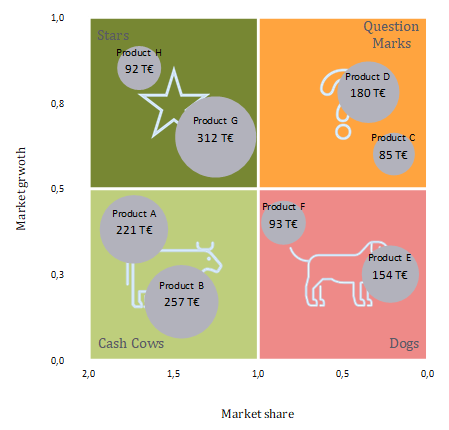
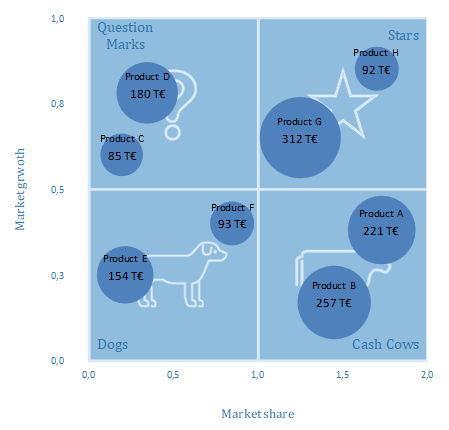
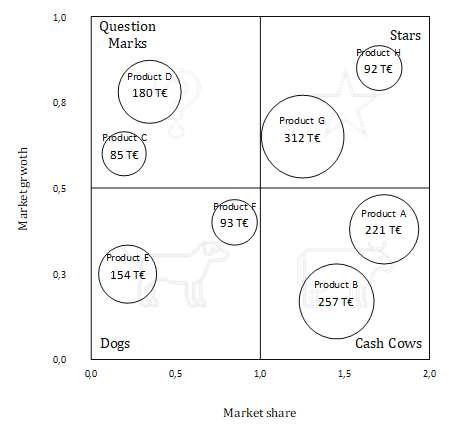
This Excel template enables you to create a portfolio matrix after the pattern of the Boston Consulting Group (also four fields matrix, growth-share matrix or BCG matrix). In a coordinate system of relative market share and market growth the products to be analyzed are displayed as circles, where the circular areas are proportional to sales.
Thanks to a special technology the Excel standard chart is extended to allow more design options for the user. The template includes detailed instructions for configuring and formatting of the chart.
Features:
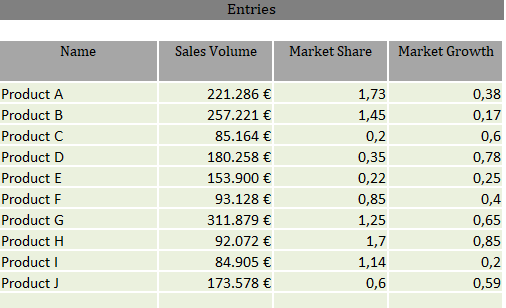
- Capture name, revenue, market share and market growth for up to 20 products
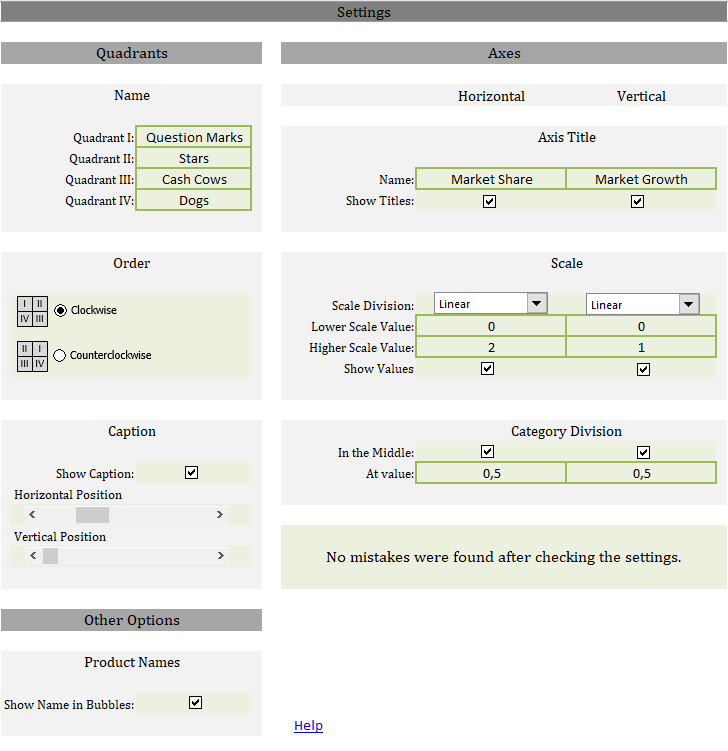
Seven prepared designs are available, which can be configured directly with just a few clicks and entries in the Excel spreadsheet:
- Alternatively label of the quadrants (default: Question Marks, Stars, Cash Cows, Dogs)
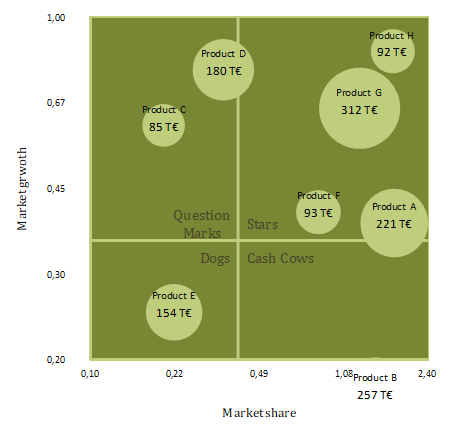
- Arrangement of the quadrants (orientation of the horizontal axis)
- Positioning of quadrant label with the help of sliders
- Optional display of the illustrations of the quadrants (Question Mark, Star, Cow, Dog)
- Switching the labels of the bubbles on and off
- Determine whether bubble areas correspond to sales or whether all bubbles should be the same size
- Editing the title of the axis (default: relative market share, market growth)
- Either linear or logarithmic axis division
- Scaling of the axes (default: relative market share - from 0 to 1, market growth - from 0 to 2)
- Setting the division lines of the quadrants (in the middle or at defined value)
The setting options are self-explanatory and their impact is immediately visible in a preview image.
The template is created for Excel version 2010. Its possible that the template does not work under Macintosh. It contains no macro (VBA) code.